You should spend about 20 minutes on this task.
The following table shows the number of factory workers for a given time period in Germany. Report the main features and make comparisons where relevant.
Task 1 – 4 paragraph: 1. Introduction, 2. Overview, 3. Analyses 4. Summary
Introduction – paraphrase the question with added detail from the graphic.
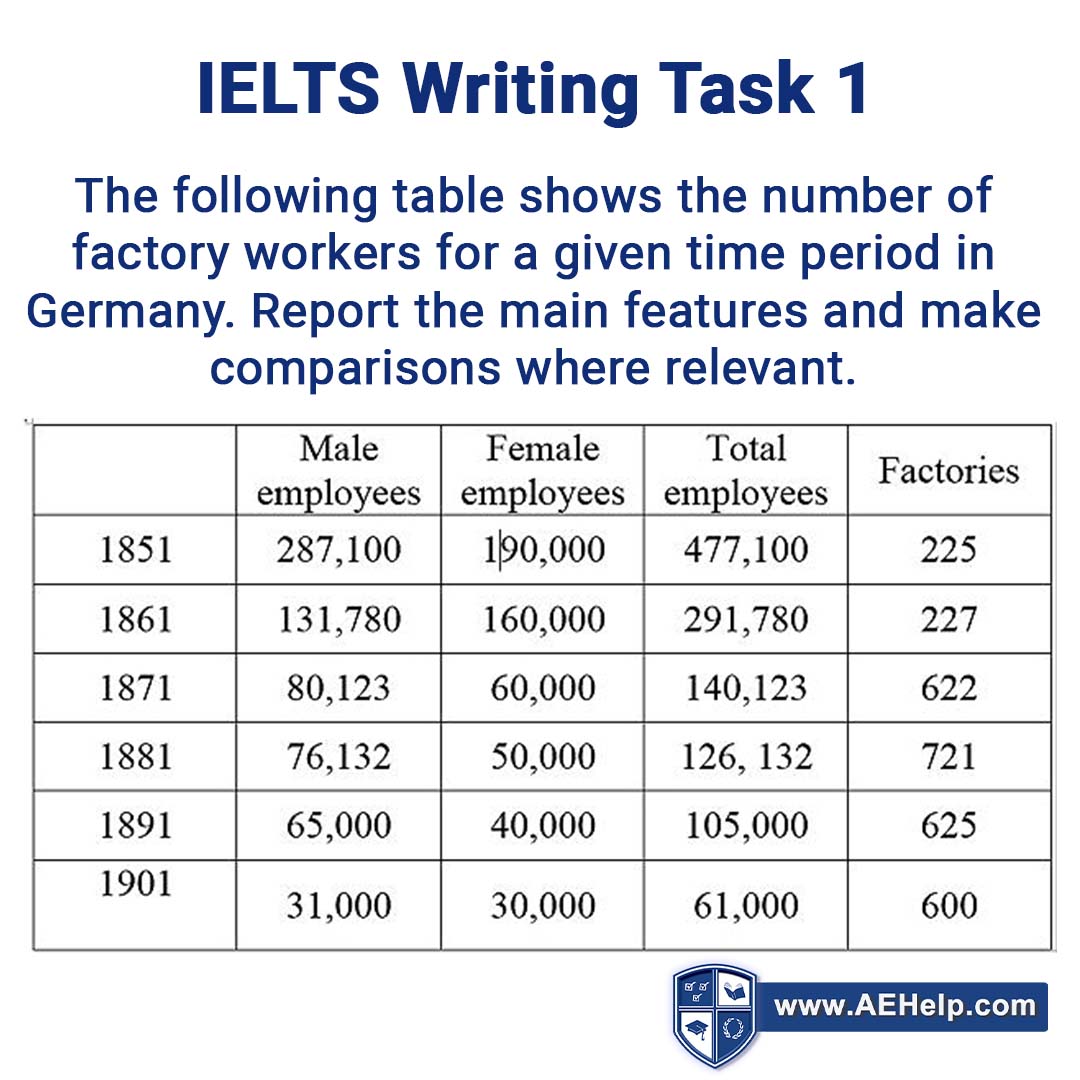
The given table has five columns and seven rows which depict the number of factory workers by gender and the total in Germany from the mid-19th century until the start of the 20th century with 10-year intervals.
4 Types of Writing: Persuasive, Descriptive, Narrative, Expository
TASK 1 Academic = Expository Essay (Describe, explain and interpret data for the audience) ***You MUST NOT give your own opinion.
*Simply explain and interpret
You should write AT LEAST 150 words.
INTRODUCTION
The given table has five columns and seven rows which depict the number of factory workers by gender, and the total, in Germany from the mid-19th century until the start of the 20th century with 10-year intervals.
OVERVIEW
An initial glance at the data reveals that in most time periods there were a greater number of males than females working in factories. In addition, the number of factory workers decreased from one decade to the next while the number of plants mostly increased over the 50 years.
ANALYSES
In 1851, over a quarter million men were working in production plants in Germany while there were 190K women doing factory work. A decade later there is a major shift in this statistic with less than half the number of men working in industrial jobs while women remain quite numerous at 160 thousand. This is the only period where female workers outnumber males. In the next four time periods, there continues to be a drop in both the men and women working in the industry with a slightly greater number of males than females in each decade. By the turn of the century, there are just 31K men and 30 women employed by the industrial sector. This change in the number of employees is clearly observable when looking at the totals; there are almost half a million factory workers in 1851, this half to 291K in 1861, again half 140K in 1871, and just 61K by 1901. The numbers of factories show an inverse trend to employees with a significant increase over the 50 year period. There are 225 production plants in 1851, only two more in 1861, but nearly triple by 1871. The most factories are in 1881 at over 700 and then there is a slight decrease in the next 20 years.
SUMMARY
In summary, by adding the columns it becomes evident that there are roughly 20% more men working in factories than women in this half century. Also, factories require fewer employees as the decade’s pass.
In case you missed it, Here is our IELTS Band 9 Tips for Speaking, Reading, Writing & Listening video. With these tips from our IELTS experts and some practice, you will be well on your way to building confidence and getting the IELTS band score you need! For more help, Use our premium IELTS course: https://www.aehelp.com/full-course/
Visit us at https://www.aehelp.com/ for more.
No Comments
Be the first to start a conversation