IELTS Task 1 Writing
You should spend about 20 minutes on the following task.
The charts below show various reasons for either biking or driving to work. Summarize the main features and make comparisons where relevant.
You should write at least 150 words.
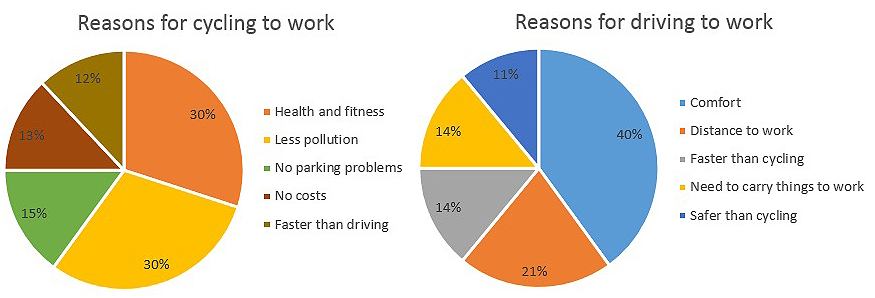
The two pie charts indicate the percentages for five reasons people choose to cycle to their employment or five reasons for driving to work; each of these reasons are clearly outlined in the legend. Immediately, it is clear that there are two dominant reasons for cycling to work as well as for driving.
OVERVIEW
The two pie charts indicate the percentages for five reasons people choose to cycle to their employment or five reasons for driving to work; each of these reasons are clearly outlined in the legend. Immediately, it is clear that there are two dominant reasons for cycling to work as well as for driving.
ANALYSES
Going into more details, about a third of all cyclists indicated health and fitness as the primary for choosing this method of transportation while another third claimed it is for less pollution. On the other hand, the largest proportion of automobile users expressed comfort as their main reason for opting to drive while half as many expressed that it was due to their distance from the workplace at 40% and 21%, respectively. The remaining three reasons people bike to work are shared fairly equally, no parking problems (15%), no cost (13%), and faster than driving (12%). Similarly, the three remaining factors for driving to work are quite equal weighted, either have cargo or faster than cycling, both 14%, and safer than cycling at 11%.
SUMMARY
In summary, it is clear that there are quite different reasons for people to either bike or drive to work, and each of these represent a significant percentage of commuters.

No Comments
Be the first to start a conversation